Configure Azure Monitor metric alerts with Infrastructure as Code
In January 2024 I submitted a post about deploying the Azure Monitor Baseline Alert (AMBA) solution. I've temporarily removed that post as the project has developed a lot since that publication and some information I had about deploying AMBA is no longer up to date. To avoid misleading anyone I will just point you to the AMBA website instead which holds all the information should that be what you are looking for.
One of the current cons of AMBA is that there is no Terraform support yet (however it is in their backlog). But maybe you as a reader have a much smaller customer or project and you feel like you do not want to deploy AMBA and all its bells and whistle. For you, I will provide an alternative which will take inspiration from AMBA for what to monitor and which thresholds to apply. However, it will be deployed using Terraform and not Azure Bicep and will be much smaller in scale.
A con of my approach that I will show you here which is a pro with AMBA is that they use Azure Policy to apply their alerts which means it scales very well. If you add more resources the AMBA monitoring policies will make sure your new resources are monitored without you even having to think about it.
Alternative solution
Another solution is to nitpick from AMBA and build our own alerts using Terraform. I will show you how this works and how you can have a configuration that will work for different environments both development and production should you want different threshholds for them.
Let's assume that we have a storage account that is hosting a lot of important data for an application we are hosting. It's important that this storage account is always available for us and that it serves requests in a timely manner. We can then monitor its availability & latency by creating metric alerts in Azure Monitor using Terraform.
First we will create the storage account:
terraform {
  required_providers {
    azurerm = {
      source  = "hashicorp/azurerm"
      version = "4.14.0"
    }
  }
}

provider "azurerm" {
  features {}
  subscription_id = var.azure_subscription_id
}

resource "azurerm_resource_group" "this" {
  name     = "rg-${var.environment}-${var.location_short}-app"
  location = var.location
}

resource "azurerm_storage_account" "this" {
  name                     = "st${var.environment}${var.location_short}app"
  resource_group_name      = azurerm_resource_group.this.name
  location                 = azurerm_resource_group.this.location
  account_tier             = "Standard"
  account_replication_type = "LRS"
}
And our variables:
variable "azure_subscription_id" {
  type        = string
  description = "Azure Subscription ID"
}

variable "environment" {
  type        = string
  description = "Environment name"
}

variable "location" {
  type        = string
  description = "Azure Region"
}

variable "location_short" {
  type        = string
  description = "Azure Region Short"
}
Now I will create a dev.tfvars where I will fill this information out and use that in my terraform apply -var-file variables/dev.tfvars command so I don't have to do it manually everytime I run apply.
azure_subscription_id = "my-sub-id"
environment           = "dev"
location              = "swedencentral"
location_short        = "sc"
Creating my resource group & storage account:
Creating the alert
Now that we have the resource and we want to monitor it we can build a variable that will allow us to add and remove metrics to monitor quite easily.
Inside our variables.tf we will declare what the variable will look like:
variable "metric_alerts" {
type = map(object({
description = string
criteria = object({
metric_name = string
metric_namespace = string
threshold = string
operator = string
aggregation = string
severity = number
skip_metric_validation = bool
})
window_size = string
evaluation_frequency = string
}))
description = "Metric alert configuration"
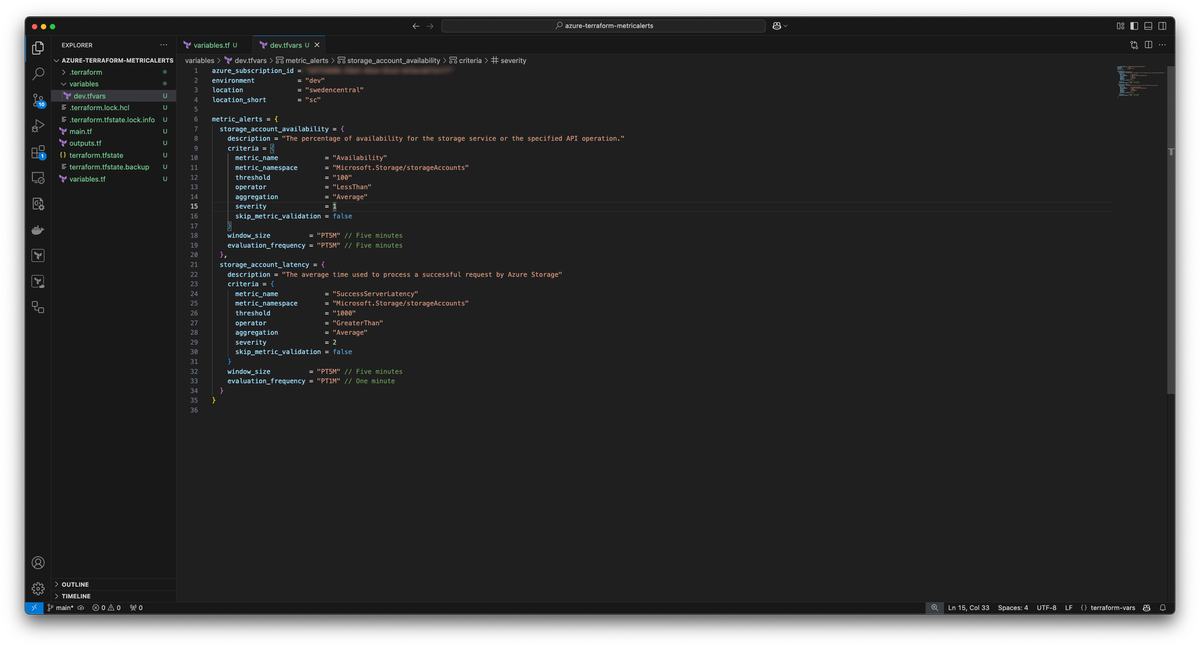
}This allows me to define multiple objects in a map so I can use this in a for_each inside our deployment. This is what I will add in my dev.tfvars file to configure two different types of metric alerts for my storage account:
metric_alerts = {
  storage_account_availability = {
    description = "The percentage of availability for the storage service or the specified API operation."
    criteria = {
      metric_name            = "Availability"
      metric_namespace       = "Microsoft.Storage/storageAccounts"
      threshold              = "100"
      operator               = "LessThan"
      aggregation            = "Average"
      severity               = 1
      skip_metric_validation = false
    }
    window_size          = "PT5M" // Five minutes
    evaluation_frequency = "PT5M" // Five minutes
  },

  storage_account_latency = {
    description = "The average time used to process a successful request by Azure Storage"
    criteria = {
      metric_name            = "SuccessServerLatency"
      metric_namespace       = "Microsoft.Storage/storageAccounts"
      threshold              = "1000"
      operator               = "GreaterThan"
      aggregation            = "Average"
      severity               = 2
      skip_metric_validation = false
    }
    window_size          = "PT5M" // Five minutes
    evaluation_frequency = "PT1M" // One minute
  }
}
The two keys inside this map are storage_account_availability & storage_account_latency

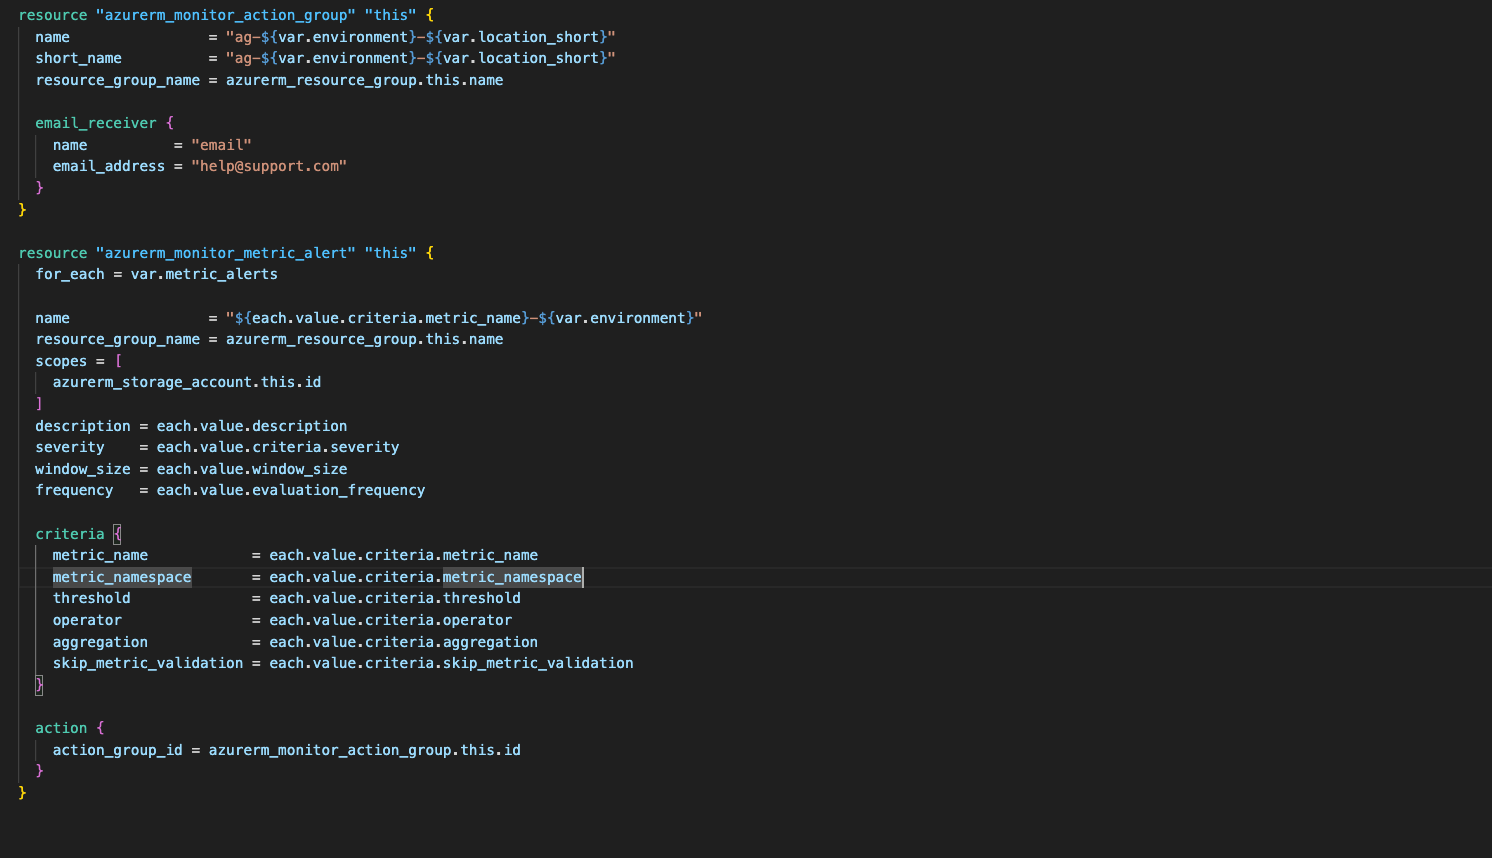
Now I just need to define my action group and a metric alert resource which I will do in my main.tf
resource "azurerm_monitor_action_group" "this" {
  name                = "ag-${var.environment}-${var.location_short}"
  short_name          = "ag-${var.environment}-${var.location_short}"
  resource_group_name = azurerm_resource_group.this.name

  email_receiver {
    name          = "email"
    email_address = "help@support.com"
  }
}

resource "azurerm_monitor_metric_alert" "this" {
  for_each = var.metric_alerts

  name                = "${each.value.criteria.metric_name}-${var.environment}"
  resource_group_name = azurerm_resource_group.this.name
  scopes = [
    azurerm_storage_account.this.id
  ]
  description = each.value.description
  severity    = each.value.criteria.severity
  window_size = each.value.window_size
  frequency   = each.value.evaluation_frequency

  criteria {
    metric_name            = each.value.criteria.metric_name
    metric_namespace       = each.value.criteria.metric_namespace
    threshold              = each.value.criteria.threshold
    operator               = each.value.criteria.operator
    aggregation            = each.value.criteria.aggregation
    skip_metric_validation = each.value.criteria.skip_metric_validation
  }

  action {
    action_group_id = azurerm_monitor_action_group.this.id
  }
}
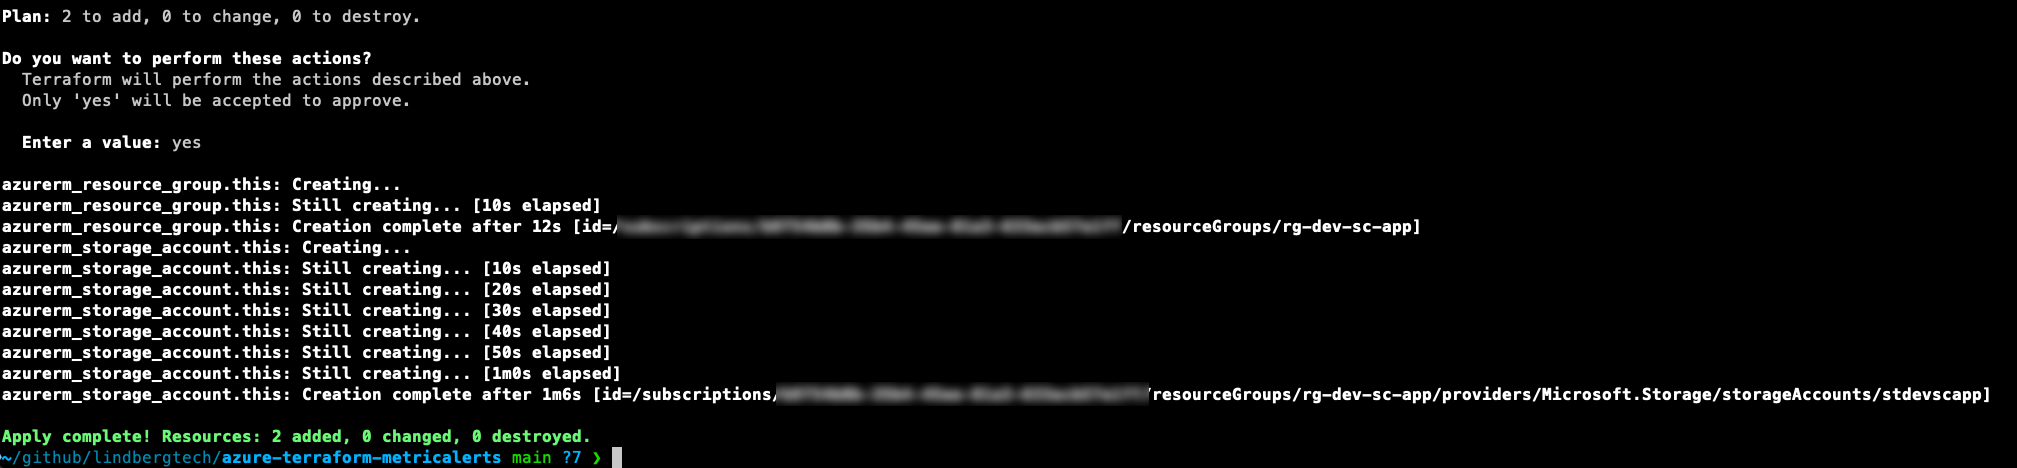
Now I will run terraform apply -var-file variables/dev.tfvars -auto-approve to deploy my solution:
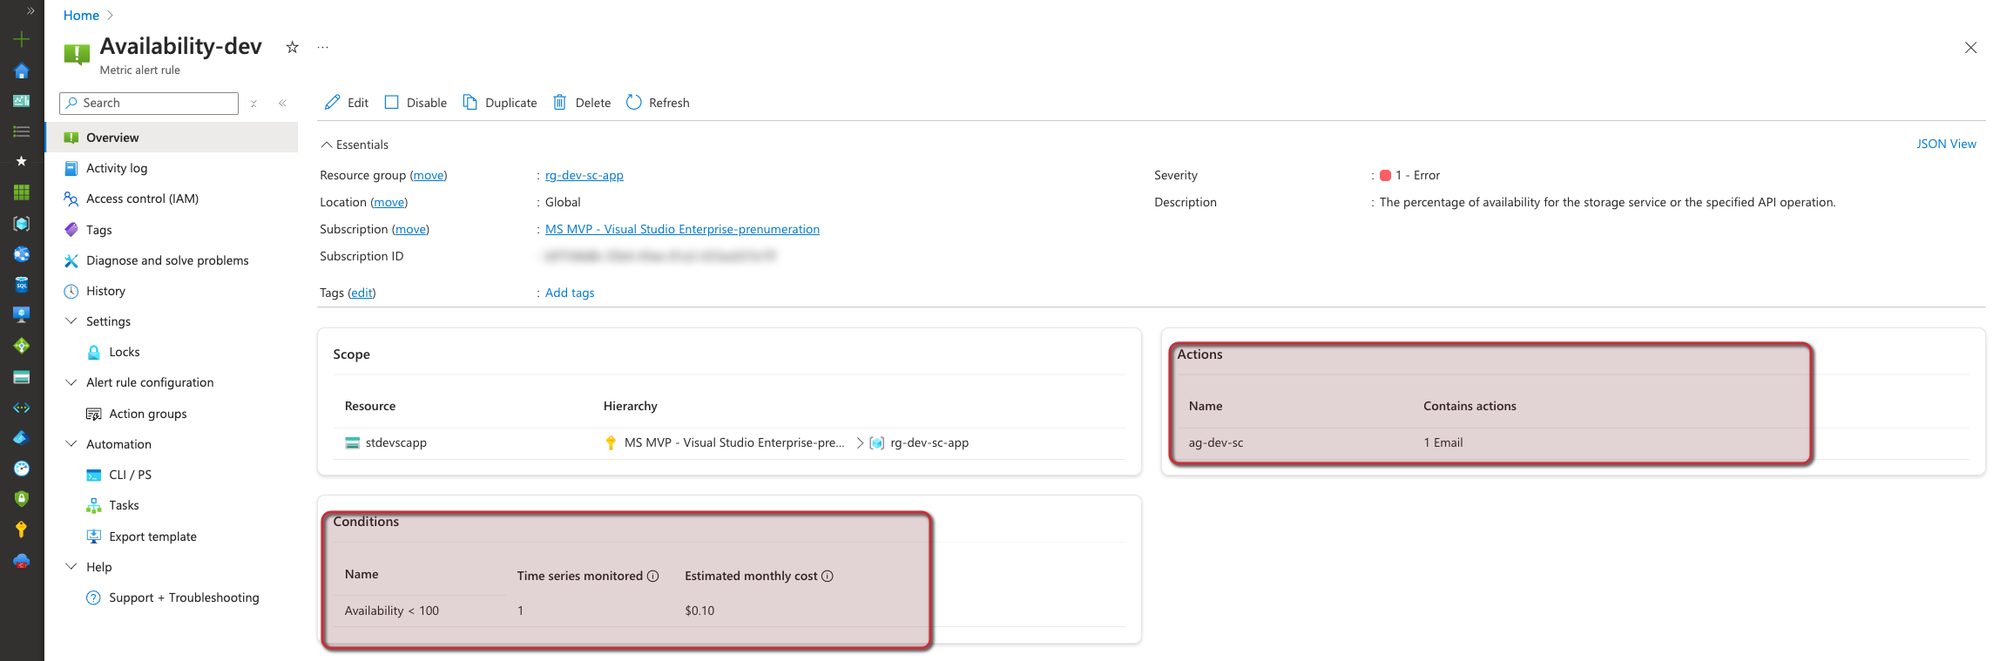
Now I've successfully deployed my storage account, I am monitoring its availability and latency and any alerts will be sent to my defined action-group email. I can do the same now by fleshing out a prod.tfvars with different values if I want other thresholds in my production which is pretty neat. I can also add and remove metrics easily from my variable or if I want to monitor something other than the storage account I can build that as well.
Hope you enjoyed!
References
About me