Configure Azure Monitor log alerts with Infrastructure as Code
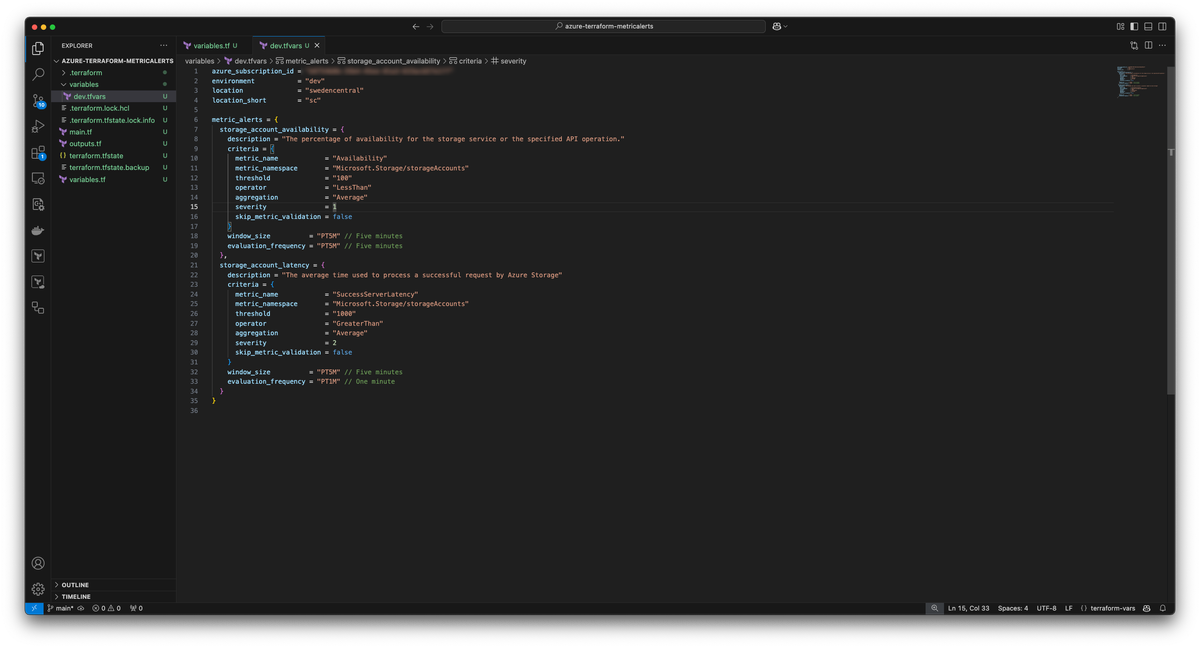
In my previous post I wrote about using Terraform to create metric alerts and it was well received. Some of you have asked if one can be done covering log alerts as well. If you haven't read the previous post I will provide a link to it HERE and in the references.
Whilst metric alerts monitors Azure resources and its conditions and fires if certain conditions are met, like CPU maxing out or there is no diskspace left, log alerts work a bit different. Log alerts use log analytics queries to monitor for certain events at a certain time interval and will fire if the condition is met. The condition could be that even just one instance of this log will trigger an alert of it or there has been five instances of this log in the last 10 minutes, this could also trigger the alert, depending on your use-case of course.
Log alerts can target single resources like a VM or a container, it could also target other things in Azure like a resource group or subscriptions.
Configure the log using Terraform
The goal is to configure a log alert rule using Terraform and I will actually steal shamelessly the example from MS learn which you can find HERE where the added value with this post is to show you how to configure it in infrastructure as code. Take this as a starting point and you can configure more things from here.
First we need to create the baseline for our Terraform project and I will create a main.tf
terraform {
  required_providers {
    azurerm = {
      source  = "hashicorp/azurerm"
      version = "4.16.0"
    }
  }
}

provider "azurerm" {
  features {}
  subscription_id = var.azure_subscription_id
}

// Existing resource group which the storage account lives in
data "azurerm_resource_group" "this" {
  name = "rg-${var.environment}-${var.location_short}-newworkspace"
}

// Existing log analytics workspace which the storage account sends logs to
data "azurerm_log_analytics_workspace" "this" {
  name                = "log-${var.environment}-${var.location_short}-newworkspace"
  resource_group_name = data.azurerm_resource_group.this.name
}
This guide assumes you already have a log analytics workspace
I have also created a variables.tf
variable "azure_subscription_id" {
  description = "Azure Subscription ID"
  type        = string
}

variable "environment" {
  description = "Environment"
  type        = string
}

variable "location" {
  description = "Azure Region"
  type        = string

}

variable "location_short" {
  description = "Azure Region Short"
  type        = string
}
And a variables/prod.tfvars folder and file:
azure_subscription_id = "your-sub-id"
environment           = "prod"
location              = "swedencentral"
location_short        = "sc"
Creating the log alert rule
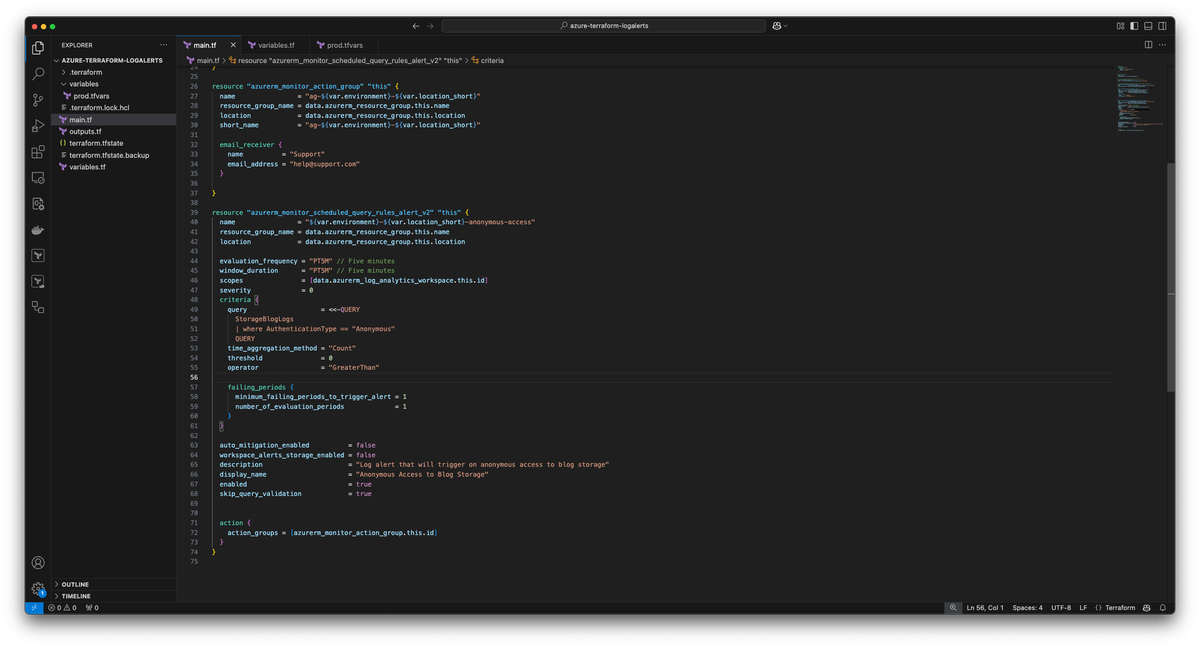
Now that we have a base ready we can start creating the alert rule with the following resouce type azurerm_monitor_scheduled_query_rules_alert_v2
resource "azurerm_monitor_action_group" "this" {
  name                = "ag-${var.environment}-${var.location_short}"
  resource_group_name = data.azurerm_resource_group.this.name
  location            = data.azurerm_resource_group.this.location
  short_name          = "ag-${var.environment}-${var.location_short}"

  email_receiver {
    name          = "Support"
    email_address = "help@support.com"
  }

}

resource "azurerm_monitor_scheduled_query_rules_alert_v2" "this" {
  name                = "${var.environment}-${var.location_short}-anonymous-access"
  resource_group_name = data.azurerm_resource_group.this.name
  location            = data.azurerm_resource_group.this.location

  evaluation_frequency = "PT5M" // Five minutes
  window_duration      = "PT5M" // Five minutes
  scopes               = [data.azurerm_log_analytics_workspace.this.id]
  severity             = 0
  criteria {
    query                   = <<-QUERY
      StorageBlogLogs
      | where AuthenticationType == "Anonymous"
      QUERY
    time_aggregation_method = "Count"
    threshold               = 0
    operator                = "GreaterThan"

    failing_periods {
      minimum_failing_periods_to_trigger_alert = 1
      number_of_evaluation_periods             = 1
    }
  }

  auto_mitigation_enabled          = false
  workspace_alerts_storage_enabled = false
  description                      = "Log alert that will trigger on anonymous access to blog storage"
  display_name                     = "Anonymous Access to Blog Storage"
  enabled                          = true
  skip_query_validation            = true


  action {
    action_groups = [azurerm_monitor_action_group.this.id]
  }
}
Note: I set skip_query_validation = true in this resource to be able to create the resource since this is just a demo (Not all logs were available to me). In a real scenario it may not be useful and should be set to false which is default

The awesome part here is that we have the KQL query inside the IaC
criteria {
    query                   = <<-QUERY
      StorageBlogLogs
      | where AuthenticationType == "Anonymous"
      QUERY
Running terraform apply -var-file variables/prod.tfvars will deploy the resources:
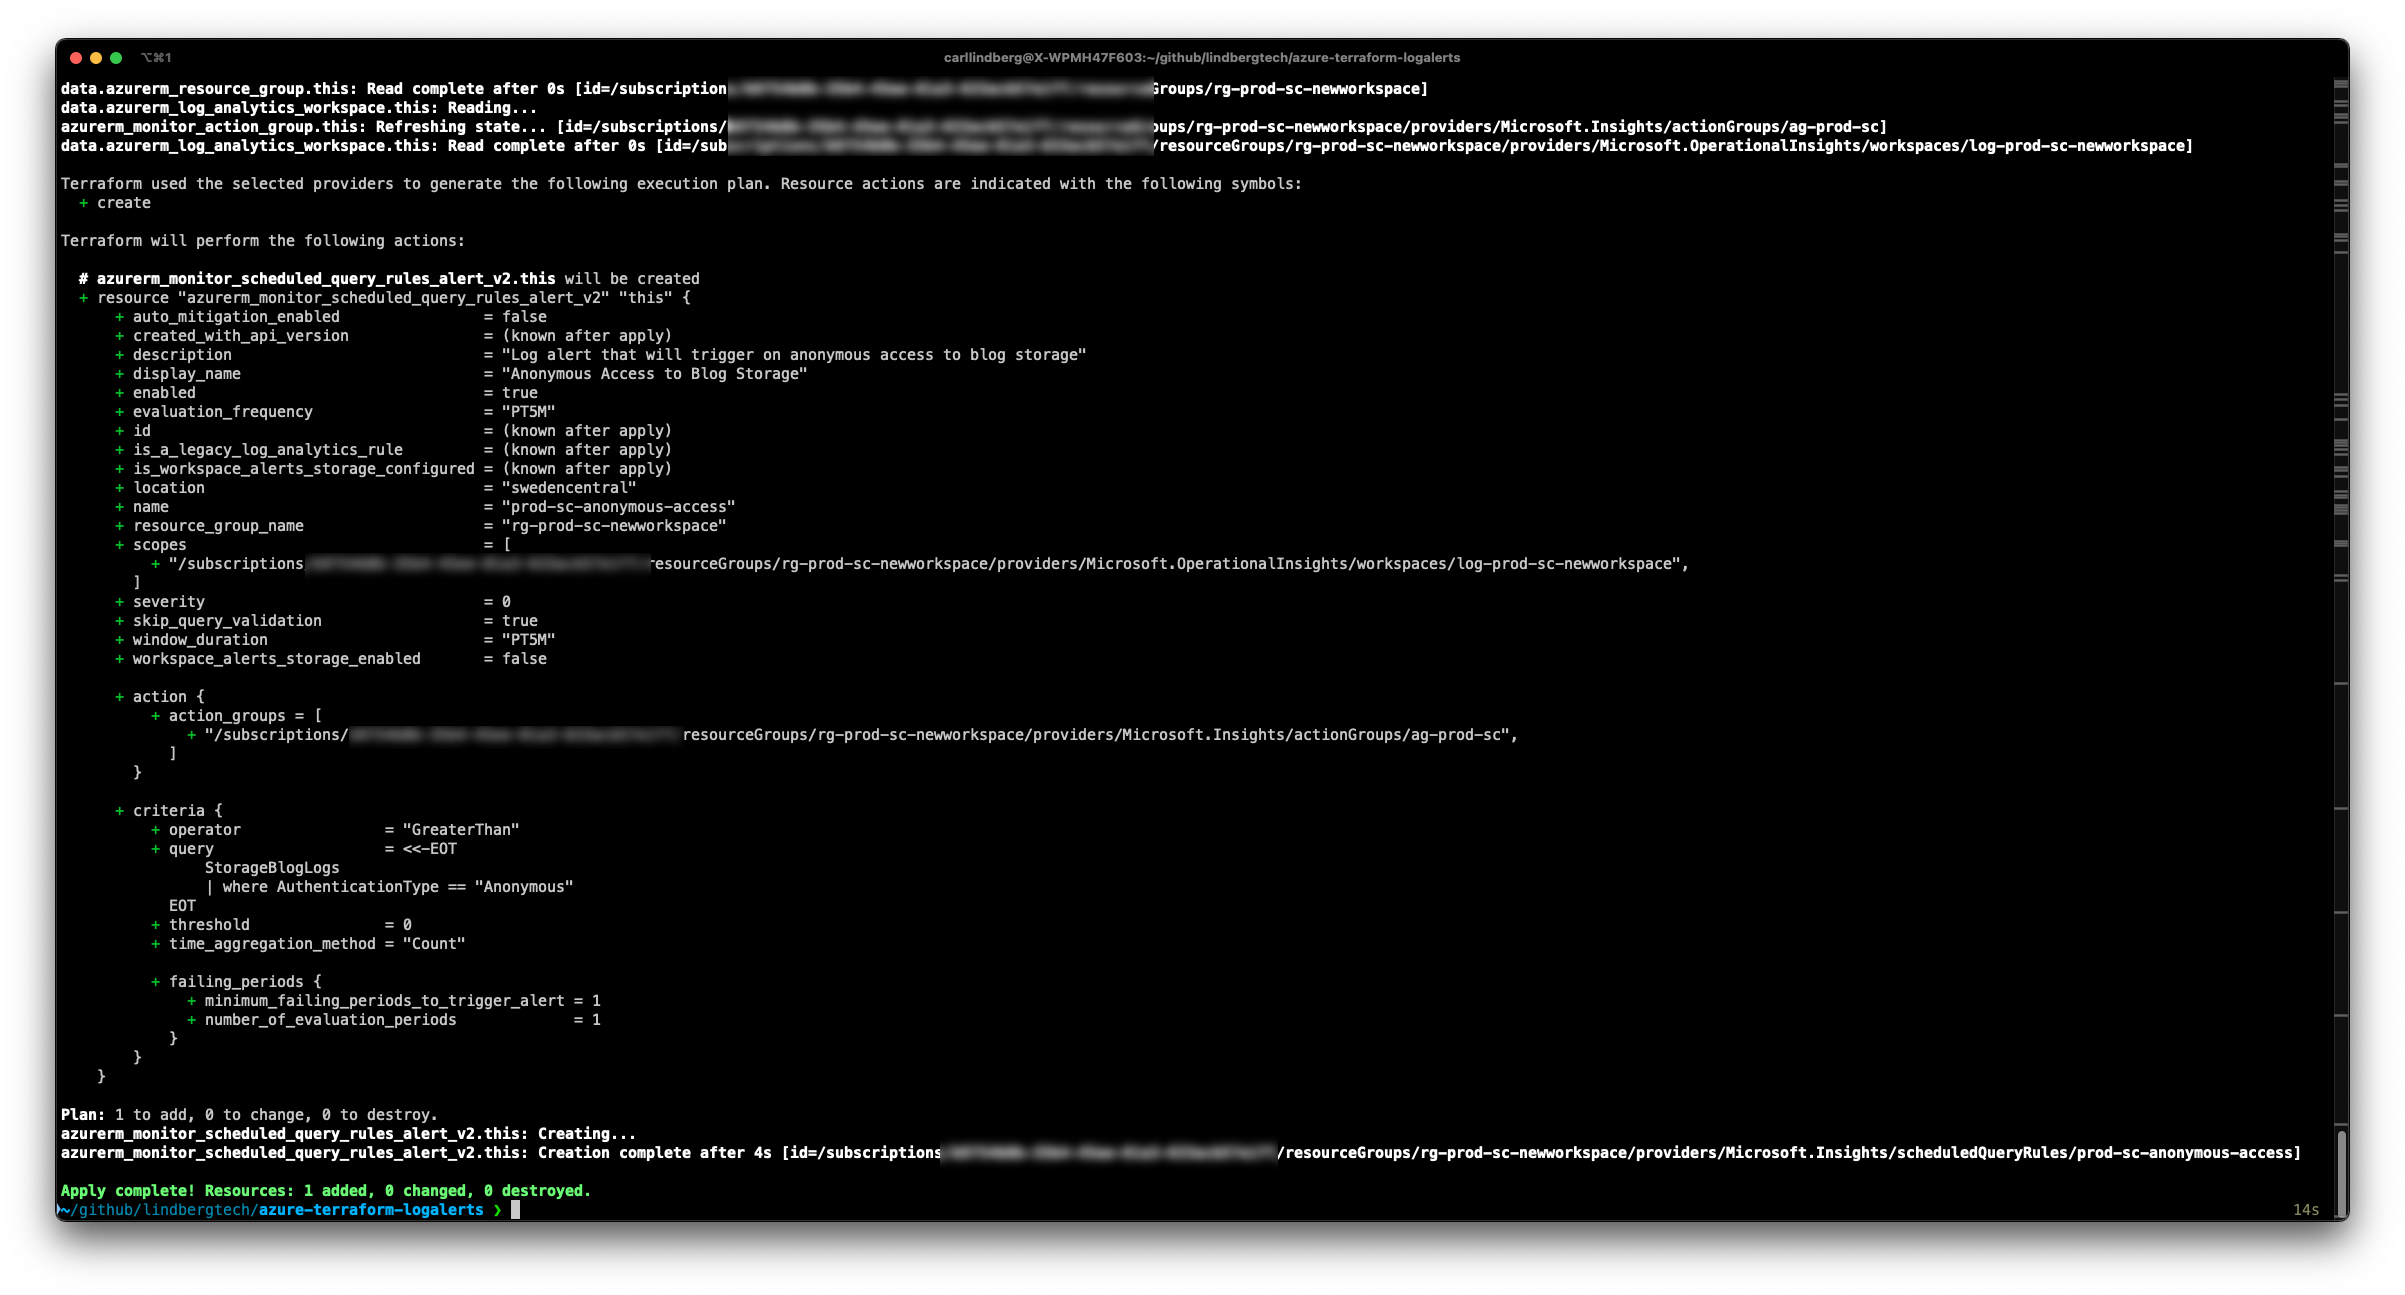
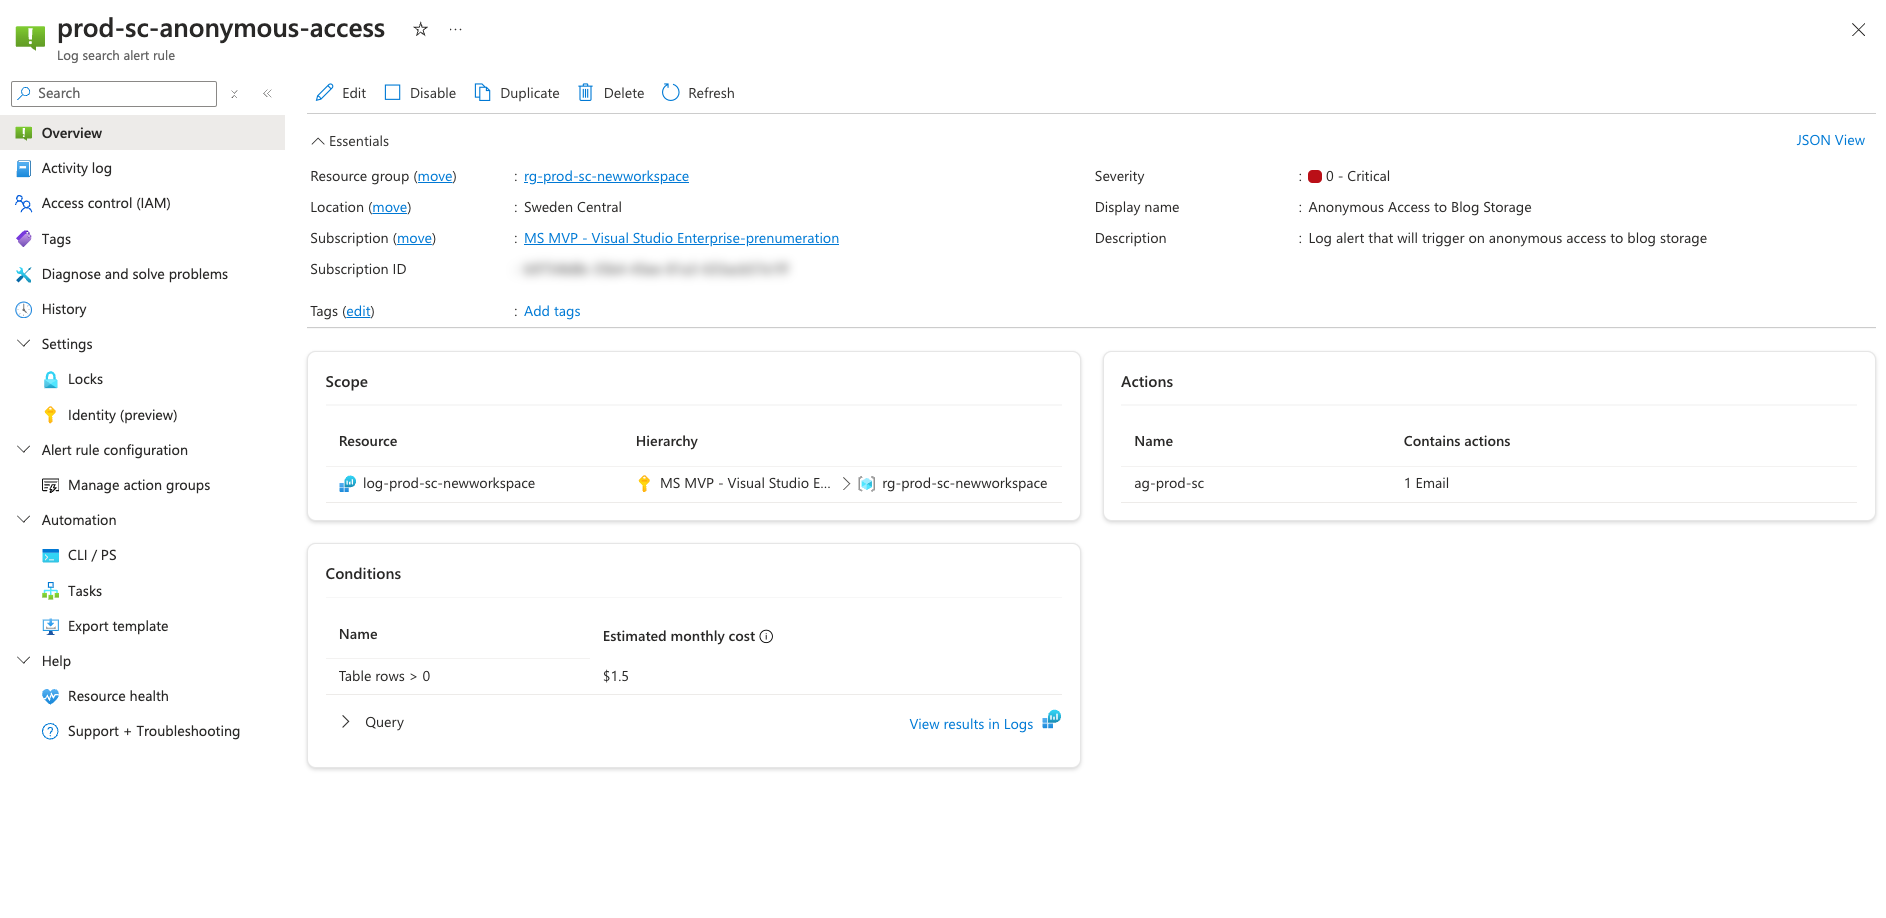
And the alert in the portal:
Conclusion
With this and the previous post we have covered both metric and log alerts with Terraform. I hope it has given you some insight into what can be achieved and spark some ideas of your own.
One can clearly see the value with this. Having alerts be created in version control and if altered it can be tracked and reviewed by a peer which is fantastic.
References
About me