Use Terraform, Datadog and Azure Logs to achieve success
Before we begin
This post will show you how to use queries in KQL which we use in Azure within log analytics, translate them into the language Datadog uses to find what you need and finally create an alert for it with Terraform and the Datadog provider!
This post does not cover how to actually get the export of logs from Azure into Datadog. There are too many variables that will decide what that looks like depending on your environment, it would be too much for this scope. If you are interested in that, you can find their documentation here:
Perhaps this is a post or video for the future though!
Azure Firewall example
Let's say we have:
- An Azure Firewall
- A diagnostic setting that streams logs to Log Analytics
- A solution that streams logs to Datadog for this resource (See before we begin section)
We want to find instances where we have a log for an IDPS signature or a Threat Intel alert, but only if it is severity 0 or 1.
The way we achieve this in Azure Log Analytics with KQL:
AZFWIdpsSignature
| union AZFWThreatIntel
| where Severity between (0 .. 1)
The way we achieve this in Datadogs log explorer:
host:<AzFw-Resource-Name> @category:(AZFWIdpsSignature OR AZFWThreatIntel) @properties.Severity:[0 TO 1]
So now we know what to look for both in Azure and in Datadog.
Accessing more properties
Should you need to, you can take a look inside AZFWIdpsSignature in the datadog logs and see more properties that you can access using @properties.{property-name}
So for example, in the datadog log explorer you can expand into properties to write them out or filter on them:
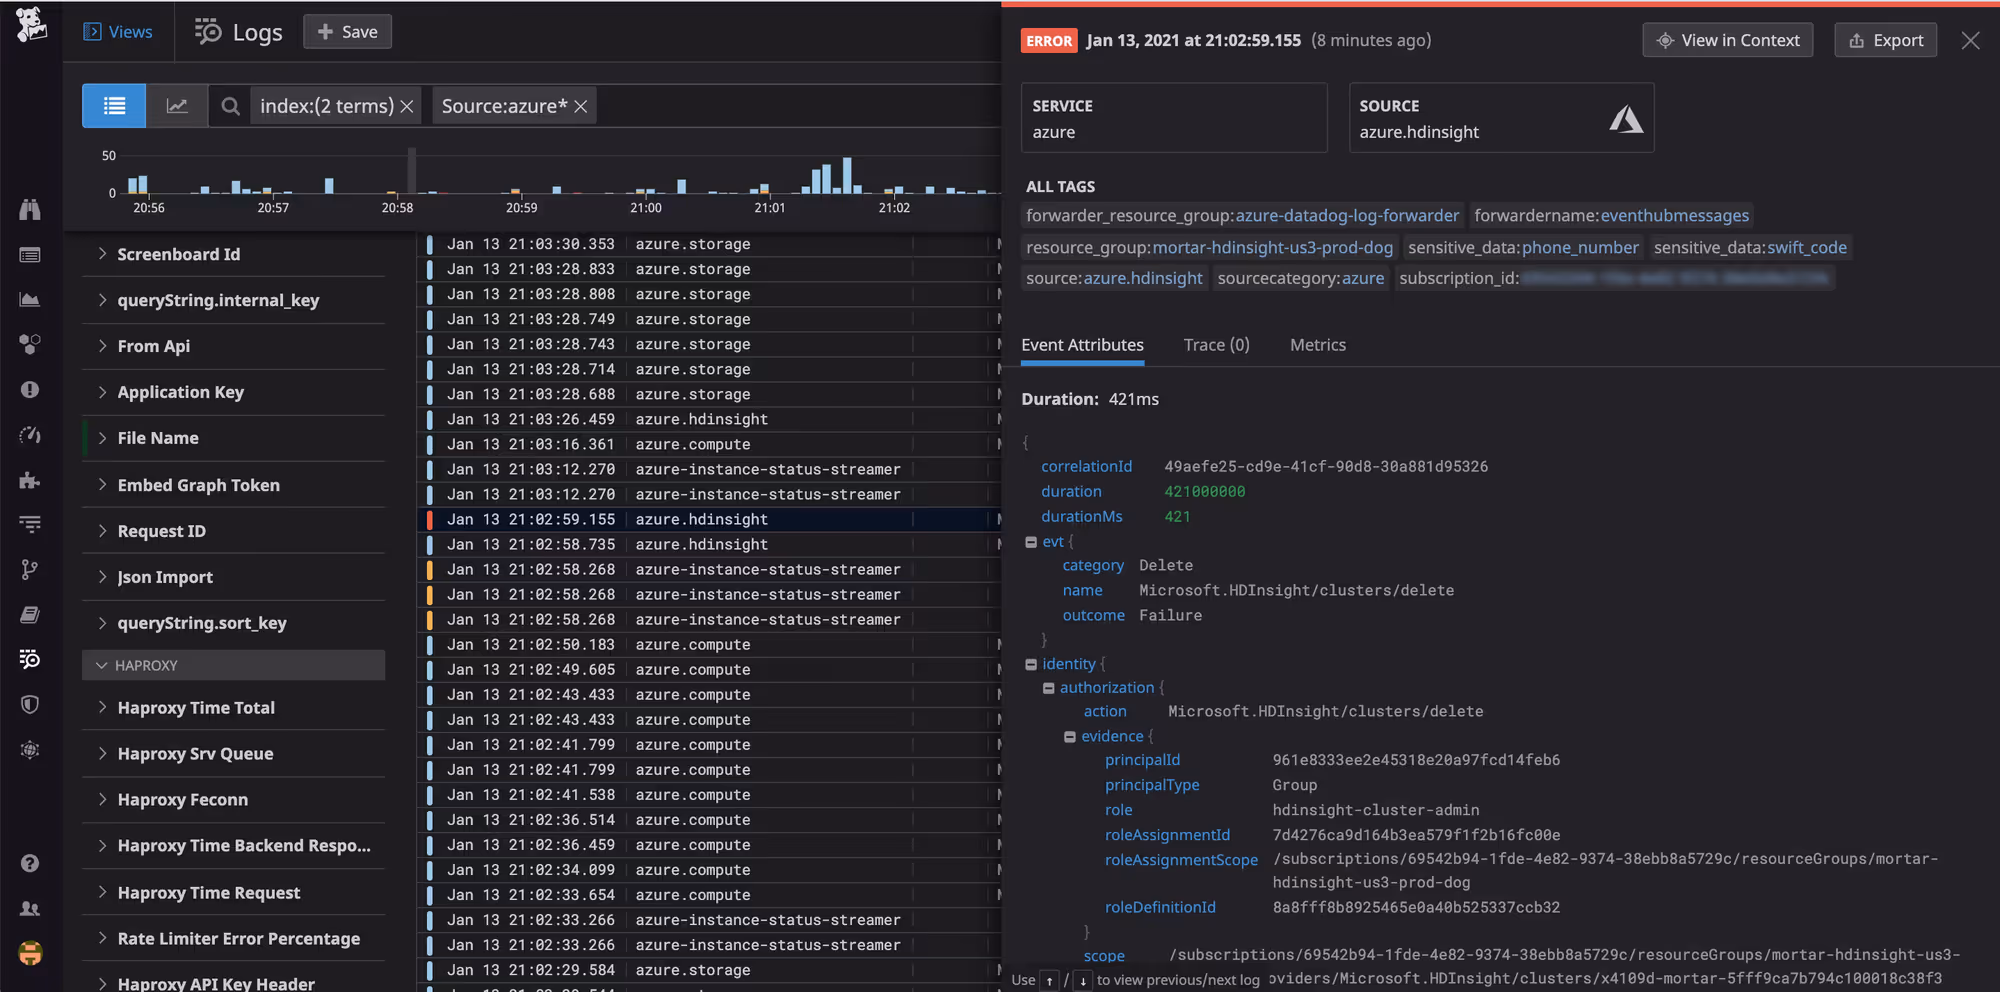
In the above example that I borrowed you could drill down into the properties this way: @identity.authorization.evidence.{property-name} and the property name could be principalId and as you can see it contains the value of a GUID that ends in ...eb6
So in the Firewall example we are working with we can use @properties.Severity:[0 TO 1] where [0 TO 1 filters the result much like how where Severity between (0 .. 1) does the same in KQL.
With this knowledge lets create our alert
Now to automate this with Terraform we can use the Datadog provider:
We are interested in a resource called datadog_monitor. Here is an example alert based on the queries we looked at earlier:
resource "datadog_monitor" "azure_firewall_idps_threat_detection" {
  name    = "log-alert-${var.environment}-${var.location_short}-firewall-threat-detection"
  type    = "log alert"
  message = <<EOT
{{#is_alert}}
Azure Firewall has generated threat detection / IDPS logs. Please investigate.

Environment: ${var.environment}


Alert details:
- Host: {{log.host}}
- Status: {{log.status}}
- Category: {{log.attributes.category}}
- Resource: {{log.attributes.resourceId}}


Properties:
- Action: {{log.attributes.properties.Action}}
- Category: {{log.attributes.properties.Category}}
- Description: {{log.attributes.properties.Description}}
- DestinationIp: {{log.attributes.properties.DestinationIp}}
- DestinationPort: {{log.attributes.properties.DestinationPort}}
- Protocol: {{log.attributes.properties.Protocol}}
- Severity: {{log.attributes.properties.Severity}}
- SignatureId: {{log.attributes.properties.SignatureId}}
- SourceIp: {{log.attributes.properties.SourceIp}}
- SourcePort: {{log.attributes.properties.SourcePort}}


Log Explorer link:
{{log.link}}


Notify: <email or team>
{{/is_alert}}
EOT

  query = <<EOT
logs("host:<AzFw-Resource-Name> @category:(AZFWIdpsSignature OR AZFWThreatIntel)")
  .index("*")
  .rollup("count")
  .last("5m") > 0
EOT

  monitor_thresholds {
    critical = 0
  }

  require_full_window = true
  include_tags        = true

  tags = []
}
There are several interesting things inside the message property.
First, we can use string-interpolation so ${var.environment} works.
We also have {{#is_alert}} and {{/#is_alert}}. Since we have our Notify section within these it means we will receive a notification once an alert is triggered, but not when an alert is resolved. Reducing spam and preventing alert fatigue.
We keep accessing log properties to format a nice looking message that will make sense like:
- SourceIp: {{log.attributes.properties.SourceIp}}
- SourcePort: {{log.attributes.properties.SourcePort}}
We add {{log.link}} in the message so an administrator can click on it and get straight into the correct place inside of Datadog.
And finally inside the query property we pass on the query and filtering that we worked on before:
query = <<EOT
logs("host:<AzFw-Resource-Name> @category:(AZFWIdpsSignature OR AZFWThreatIntel) @properties.Severity:[0 TO 1]")
  .index("*")
  .rollup("count")
  .last("5m") > 0
EOT
If this query returns anything greater than 0 in the last five minutes we receive an alert
Final message body
All of this can give us a message body that looks like this for example:
Azure Firewall has generated threat detection / IDPS logs.

Environment: Production

Alert details:
- Host: fw
- Status: info
- Category: AZFWIdpsSignature
- Resource: <azure-resource-id>

Properties:
- Action: drop
- Category: Attempted Administrator Privilege Gain
- Description: NETBIOS Microsoft Windows NETAPI Stack Overflow Inbound - MS08-067 (11)
- DestinationIp: 10.20.1.4
- DestinationPort: 445
- Protocol: TCP
- Severity: 1
- SignatureId: 2008701
- SourceIp: 10.10.1.4
- SourcePort: 50299
Pretty awesome stuff.
Wrapping up
Hopefully this inspired you and gave you some ideas of your own on how you can manage logs and alerts cross platform. If you want to delve deeper into how logging works in Azure maybe check out this video on the topic?
Also don't forget to spread the word about this blogpost / newsletter to your friends and have them sign up here to not miss any future posts!
Have a good one!
References


About me