Avoiding Disk Space Issues on Azure VMs with KQL Query-Based Alerts

Introduction
In this blog post, we'll discuss how to monitor disk space on virtual machines in Azure using data collection rules and writing KQL (Kusto Query Language) queries to create alerts that trigger when disk space is running low.
By default Azure offers you some common alert rules to configure for a virtual machine. However, I found that this sometimes does not cover specific drives such as C:\ or D:\, it gathers the entire free diskspace across all drives on the VM under an instancename called _Total which is not always helpful.
I will show you how to remediate this here.
Set up a data collection rule
A data collection rule in Azure can be used to collect performance metrics, logs and other data for your Azure Virtual Machines. You can configure rulesets for performance metrics once and then apply this to several virtual machines by adding them as a source in the data collection rule instead of configuring VM by VM.
- Login to the Azure Portal and search for Data collection rules
- Select + Create
- Enter a rule name, example: dcr-vmperf-weu-001
- Select your appropriate Subscription & Resource Group
- Select your region
- Select platform type, in my case I select Windows
- I will leave Data Collection Endpoint as <none> for now
- Under Resources we can select + Add resources, filter until you find the virtual machine you want, click the checkbox and selet Apply
- Under Collect and Deliver select + Add data source
- Under Data source type select Performance Counters
It will pick some defaults for CPU, memory, disk & network. Here is the gotcha that I troubleshooted for hours until I was able to solve.
If we want to perform inventory of specific disk drives we need to go under Custom when on the Add data source blade.
In the textbox we want to add the below performance counters:
\LogicalDisk(*)\Free Megabytes
\LogicalDisk(*)\% Free Space
11. Select Destination and click on Azure Monitor Metrics (Preview) and change to Azure Monitor logs and select a log analytics workspace, if you do not have one you can create one
12. Select Add data source & Review + create -> Create
It will take some time for the logs to appear in the Log Analytics Workspace and it can take even longer for the DCR to collect InstanceName per drive and not only the _Total InstanceName.
Build queries and create alerts
Once we have some logs to work with you want to navigate to your log analytics workspace in the Azure Portal and head to Logs in the left navigation pane.
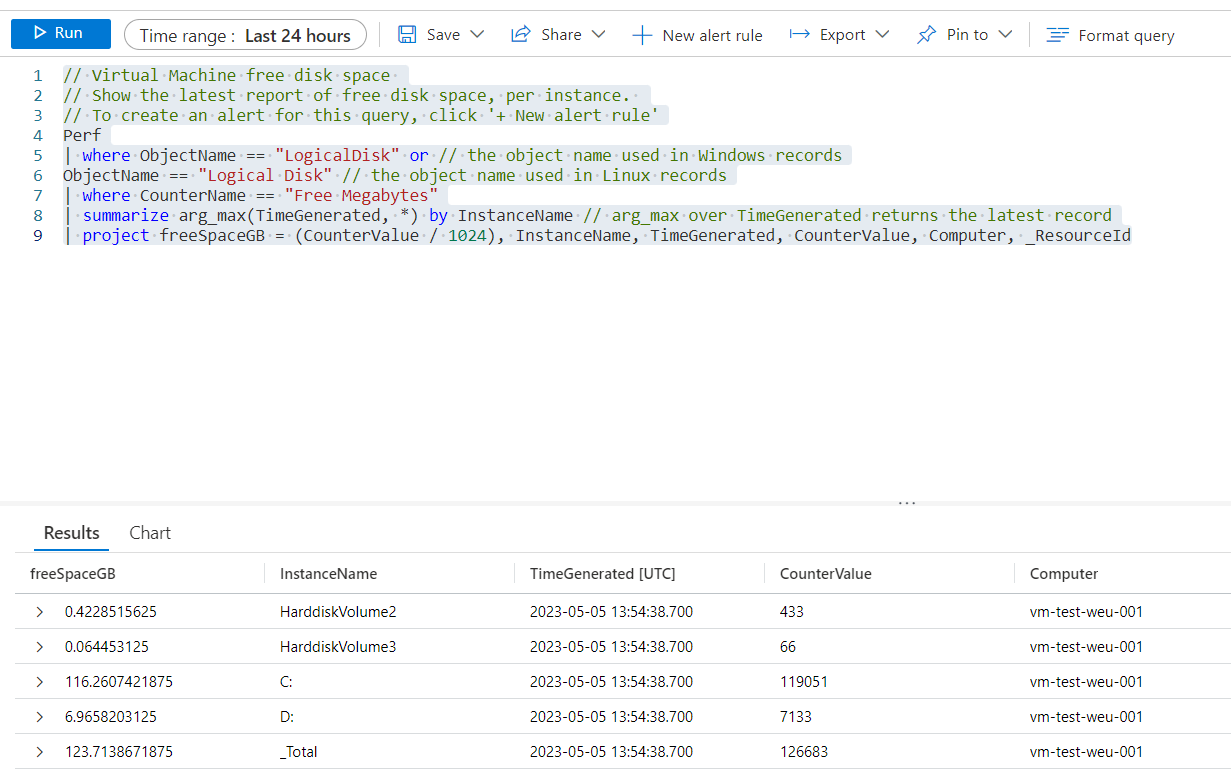
You can run the following query to list all of your drives and how much available space they have left. I will demonstrate with Free Megabytes but with some slight adjustments you can use % Free Space as well.
// Virtual Machine free disk space
// Show the latest report of free disk space, per instance.
// To create an alert for this query, click '+ New alert rule'
Perf
| where ObjectName == "LogicalDisk" or // the object name used in Windows records
ObjectName == "Logical Disk" // the object name used in Linux records
| where CounterName == "Free Megabytes"
| summarize arg_max(TimeGenerated, *) by InstanceName // arg_max over TimeGenerated returns the latest record
| project freeSpaceGB = (CounterValue / 1024), InstanceName, TimeGenerated, CounterValue, Computer, _ResourceId
This gives me the following output:
I can now add the following line at the end of the query:
| where freeSpaceGB < 200If you only want to get the results of one specific drive add this:
| where InstanceName == "C:"This will only give me a result if there is less than 200GB left on the disk. With this logic I can create a log alert rule that will trigger if log count found is greater than 0.
The entire query:
// Virtual Machine free disk space
// Show the latest report of free disk space, per instance.
// To create an alert for this query, click '+ New alert rule'
Perf
| where ObjectName == "LogicalDisk" or // the object name used in Windows records
ObjectName == "Logical Disk" // the object name used in Linux records
| where CounterName == "Free Megabytes"
| where InstaceName == "C:"
| summarize arg_max(TimeGenerated, *) by InstanceName // arg_max over TimeGenerated returns the latest record
| project freeSpaceGB = (CounterValue / 1024), InstanceName, TimeGenerated, CounterValue, Computer, _ResourceId
| where freeSpaceGB < 200Note: In this case we are sending the performance logs to a log analytics workspace. There is an option when configuring data collection rules to send them to Azure monitor metrics directly (preview).
I will explore this option more in the future but essentially you can view metrics for the machine directly without storing logs in a workspaceor configuring any other insight service.
About the author